Visualizing Information
The Digital Learning & Scholarship team can help you transform quantitative and qualitative data into visually effective charts, graphs, and infographics. We can help you work with data using tools such as:
- RAWGraphs: Play with a wide range a chart types
- Voyant Tools: Analyze texts as data
- Canva: Integrate data visualization and graphic design
Data and Information Visualizations Created at Davidson:
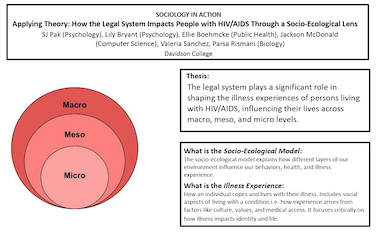
How the Legal System Impacts People with HIV/AIDS
Poster by students in SOC 232: Medical Sociology
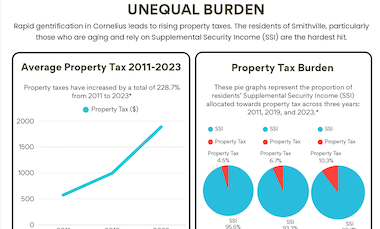
Unequal Burden
Poster by students in AFR 495: Africana Capstone